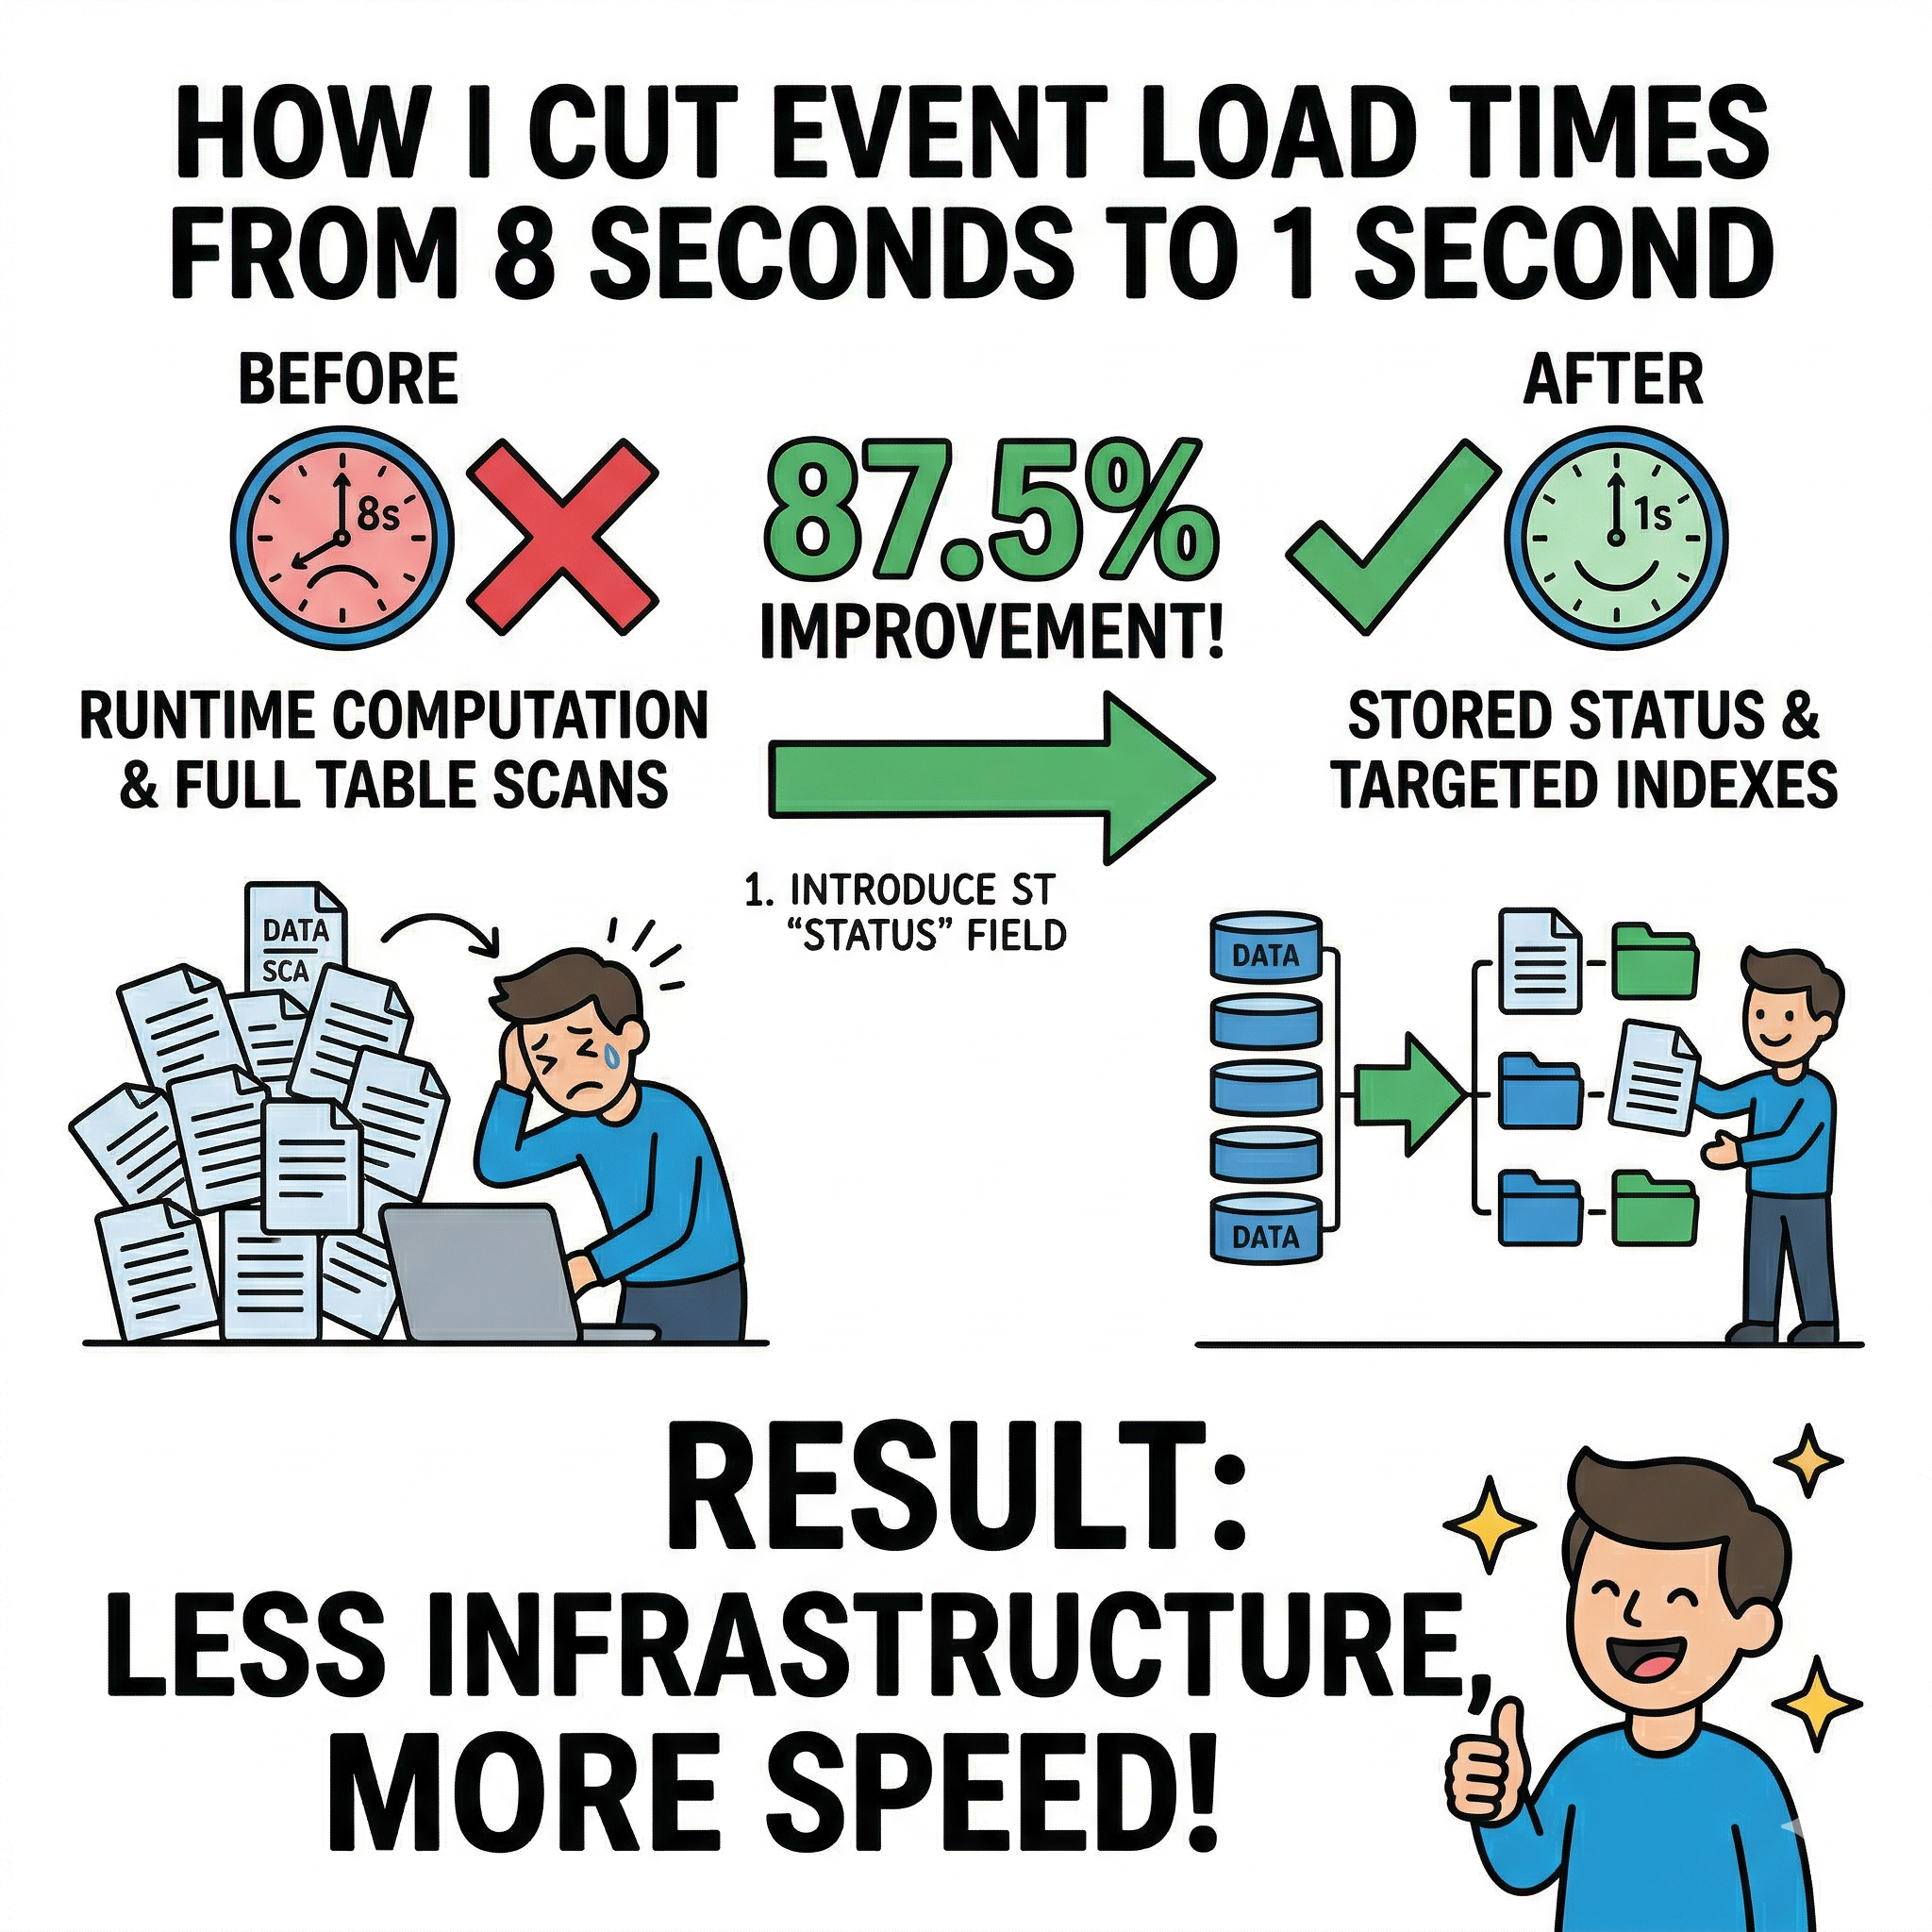
How I Cut Event Load Times from 8 Seconds to 1 Second
By tracing a slow page all the way to the database — and refusing to stop at "good enough."
During my internship at DevRelSquad (now part of GoAvo.ai), I worked on improving the performance of an events listing page that was noticeably slow under real-world usage.
The endpoint powering this page was taking 6 to 8 seconds to return a response for what should have been a straightforward paginated query. Given competing priorities in a fast-moving environment, this hadn't been deeply investigated yet.
I decided to trace it end-to-end — from the browser to the database — to understand exactly where the time was going.
The Symptom
The events listing endpoint handled filtering, pagination, and scoping by status, ownership, and date. On paper, routine. In practice, response times were inconsistent and slow enough to meaningfully impact usability.
The delay was clearly coming from the API layer rather than the frontend, so I focused on the backend path.
Step 1: Isolating the Bottleneck
I added timing instrumentation around the database call to break down the request lifecycle.
The result was immediate: the vast majority of the latency — 6 to 8 seconds — was being spent inside the database query itself. Application logic and serialization contributed almost nothing.
That narrowed the problem space considerably.
Step 2: Understanding the Data Access Pattern
When I dug into how the endpoint determined which events to show, I found the real issue — and it wasn't just a query problem. It was a schema design problem.
Event status wasn't stored on documents. It was derived at runtime by comparing timestamps: end date in the past means completed, start date in the future means upcoming, and so on. The application was fetching a broad set of documents and computing status in memory after the fact.
Since status wasn't stored, it couldn't be indexed. And without an index, every query was a full collection scan — MongoDB reading through the entire collection on every single request.
# Illustrative example — not production code

events = db.events.find({})  # broad fetch, minimal DB-level filtering

for event in events:
    if event["end_date"] < now:
        event["status"] = "completed"
    elif event["start_date"] > now:
        event["status"] = "upcoming"
    # status filtered in application memory afterward
At scale, this is exactly as expensive as it sounds.
Step 3: Designing the Fix
The improvement had two parts, and both were necessary.
Store status explicitly. Rather than computing status on every read, I introduced a stored field with discrete values — active, draft, archived. This shifts a small amount of work to write time in exchange for dramatically faster reads. It also makes the data model more accurate: status is a real business concept, not a byproduct of timestamp arithmetic.
Build indexes around it. With a stored status field, I could create compound indexes designed around actual query patterns — leading with status as the most selective field, followed by ownership and date fields used for scoping and range queries.
| Purpose | Fields |
|---|---|
| Basic filtering | status |
| Tenant scoping | status, tenant_id |
| Ownership filtering | status, owner_id |
| Past events | status, end_date (desc) |
| Upcoming events | status, start_date (asc) |
MongoDB compound indexes are consumed left-to-right. Leading with status meant the query planner could immediately narrow to the relevant slice of the collection before touching anything else.
Step 4: Updating the Query Logic
With the new schema and indexes in place, the queries needed to be rewritten to use them.
One important consideration was backward compatibility: existing documents pre-dated the new status field, so queries needed to handle documents where the field was absent, empty, or explicitly set — without requiring an immediate full migration.
# Illustrative example — not production code

if requested_status == "active":
    query["$or"] = [
        {"status": {"$exists": False}},  # legacy docs without the field
        {"status": ""},                   # docs with empty string
        {"status": "active"}              # explicitly active
    ]
else:
    query["status"] = requested_status
This pattern was applied consistently across list queries, single-record fetches, navigation logic, and aggregation pipelines.
Step 5: Measuring the Impact
Performance was validated in staging against realistic data volume, using MongoDB's explain("executionStats") to confirm actual query plan behaviour — not just wall-clock times.
Before:
- Plan:
COLLSCAN - Documents examined: large portion of the collection
- Response time: ~8 seconds
After:
- Plan:
IXSCAN - Documents examined: a small, targeted fraction
- Response time: ~1 second
87.5% reduction in response time.
I presented the explain() output, timing comparisons, and code diff to my seniors. They approved it for production.
Step 6: Shipping It
Rollout was incremental — indexes built in the background, schema handled mixed document states safely, and monitoring confirmed the improvement held consistently in production.
The events page went from feeling broken to feeling instant.
Why It Worked
Move computation to write time. Deriving status once on write avoids repeating that work on every read. At scale, read-heavy endpoints feel this trade-off immediately.
You can't index a computed value. Making status a real stored field was the prerequisite for everything else. No schema change, no index, no improvement.
Lead with your most selective field. Compound indexes are consumed left-to-right. Status as the leading key meant MongoDB could discard most of the collection before applying any other condition.
Handle schema transitions safely. Supporting mixed document states with a $or pattern kept queries correct without a risky upfront migration.
explain() is ground truth. COLLSCAN vs IXSCAN in execution stats tells you definitively what the query planner is doing. Don't guess.
One Thing to Watch
Endpoints that sort heavily on _id can occasionally have the query planner choose a status-based index, resulting in an in-memory sort step. At current scale this isn't an issue, but extending indexes to include the sort field would be the natural next step if it ever becomes one.
The Takeaway
The performance problem wasn't caused by a single bad query. It was caused by a mismatch between how data was modelled and how it was accessed — status was a concept that lived in the application layer but had no representation in the database.
By storing it, indexing it, and querying it correctly, the system moved from full collection scans to targeted index lookups.
8 seconds → 1 second. No new infrastructure.
Debugging a slow endpoint? Check the query plan first. If you see COLLSCAN on a filtered query, it's often a sign that the data model and indexing strategy need revisiting — not just the query itself.